The Factory Construction Boom, Charted: How High It Went and How Far It Has Cooled
Census data show U.S. manufacturing construction spending tripled from 2021 to a 2024 peak, then fell about 32%. Here's the boom and cooldown in charts.
Key takeaways
- Spending on U.S. manufacturing construction hit a record annual rate of about $250.2 billion in September 2024, Census data show, roughly three times the level of August 2021.
- By August 2026 it had fallen to about $170.7 billion, down about 32% from the peak and about 19% from a year earlier.
- Even after the drop, factory construction is still about double its pre-boom level and roughly 8 times its August 2002 level, in current dollars.
- Manufacturing's share of all nonresidential construction spending rose from 9.6% in August 2021 to 19.1% in August 2024, then slipped to 13.0% in August 2026.
Short answer: America's factory construction boom was real, and it was historic. Census data show spending on manufacturing construction roughly tripled between 2021 and late 2024, peaking at an annual rate of about $250 billion. Since then it has cooled steadily, to about $171 billion in August 2026. That's a drop of about a third, but it still leaves building activity about twice its pre-boom level.
Here's what the numbers show, and what they don't.
What does "manufacturing construction spending" measure?
The U.S. Census Bureau estimates the value of construction work put in place each month across the country, broken out by type. The manufacturing category covers new factories, plant expansions and major renovations of manufacturing facilities. FRED, run by the Federal Reserve Bank of St. Louis, republishes the series as TLMFGCONS.
Three details matter when you read it:
- It counts work done that month, not projects announced. A $10 billion plant shows up gradually over several years of construction.
- It's a seasonally adjusted annual rate, so each monthly figure shows what a full year would total at that pace.
- It's in current dollars, not adjusted for inflation. Some of the rise reflects higher costs for materials and labor.
How big did the factory construction boom get?
U.S. manufacturing construction spending, 2002–2026
August of each year, billions of dollars, seasonally adjusted annual rate
Current dollars, not adjusted for inflation. The monthly peak was $250.2 billion in September 2024. August 2026 is a preliminary estimate and may be revised.
Source: U.S. Census Bureau via FRED (TLMFGCONS)
View the data
| Year (August) | Spending ($ billions, SAAR) |
|---|---|
| 2002 | $20.8 |
| 2003 | $21.6 |
| 2004 | $22.7 |
| 2005 | $29.2 |
| 2006 | $36.2 |
| 2007 | $40.8 |
| 2008 | $54.9 |
| 2009 | $56.1 |
| 2010 | $39.6 |
| 2011 | $43.8 |
| 2012 | $47.9 |
| 2013 | $54.9 |
| 2014 | $59.8 |
| 2015 | $84.4 |
| 2016 | $80.8 |
| 2017 | $68.3 |
| 2018 | $75.1 |
| 2019 | $81.5 |
| 2020 | $74.3 |
| 2021 | $81.4 |
| 2022 | $128.1 |
| 2023 | $206.4 |
| 2024 | $249.8 |
| 2025 | $211.1 |
| 2026 | $170.7 |
For two decades, factory construction moved in a fairly narrow band. In August 2002 the annual rate was about $20.8 billion. It climbed to about $56.1 billion in August 2009, dropped during the recession that followed, and by August 2015 had reached about $84.4 billion. From 2016 to 2021 it hovered between roughly $68 billion and $82 billion.
Then it took off:
- August 2021: about $81.4 billion
- August 2022: about $128.1 billion
- August 2023: about $206.4 billion
- August 2024: about $249.8 billion
The monthly peak came in September 2024, at about $250.2 billion. That's roughly three times the August 2021 rate in a little over three years.
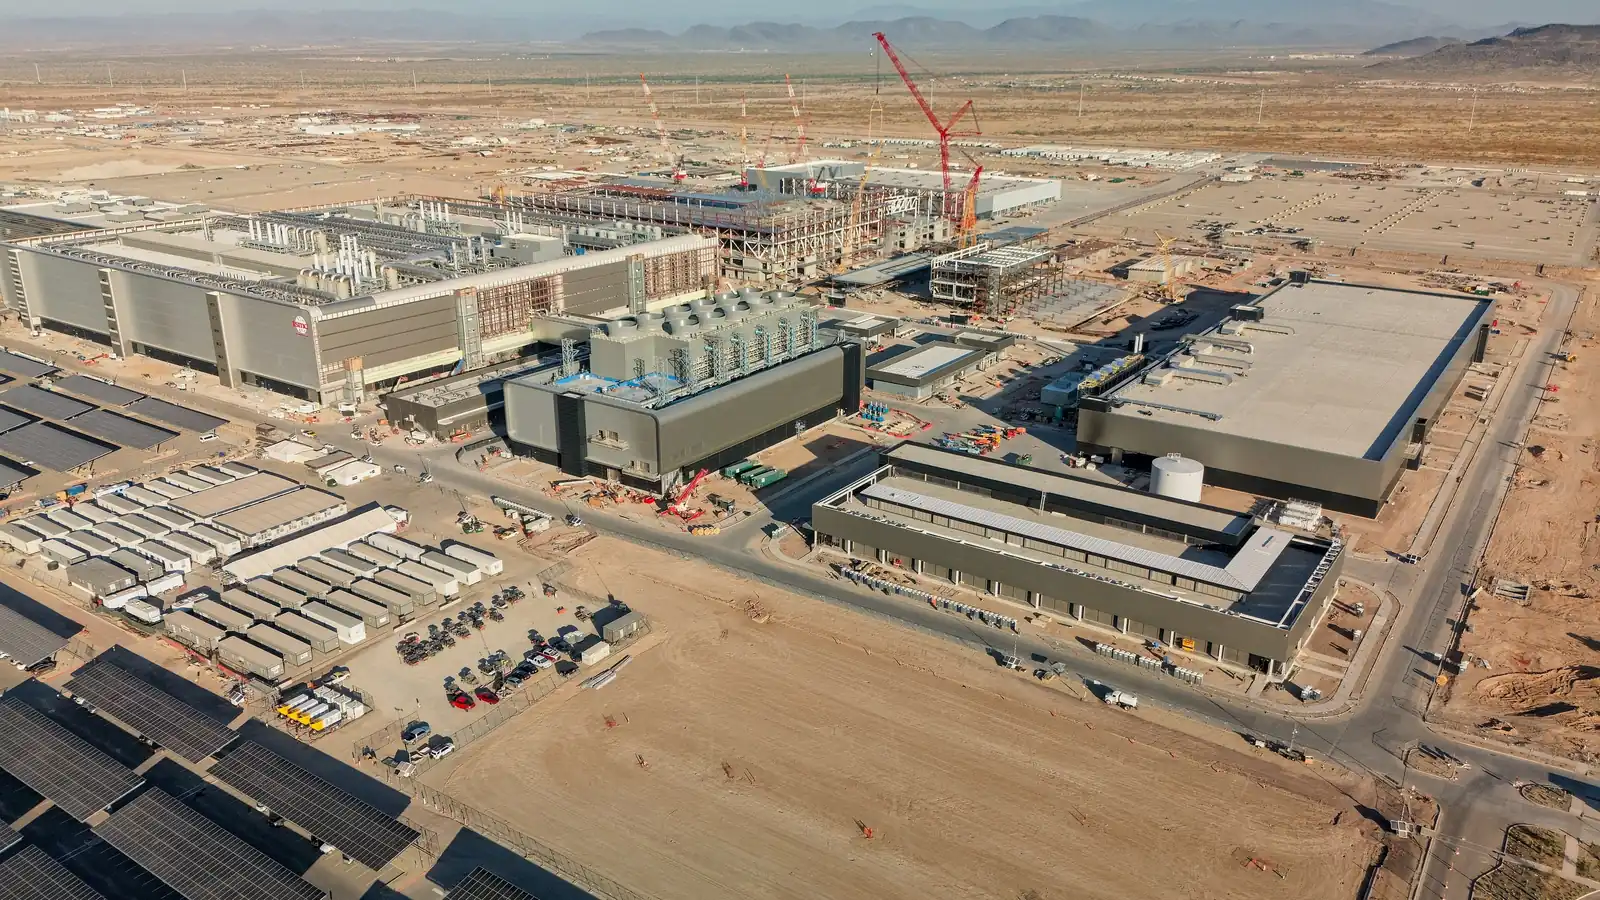
Among the most visible projects of the period were new chip plants, like the TSMC factory in north Phoenix shown in our header photo in November 2023. Census data don't break spending out by individual project or by industry within manufacturing, so we can't say exactly how much chips, batteries or any one plant contributed. What we can say is that the jump was far larger than any earlier swing in the 25 years shown.
Is factory construction slowing down now?
Yes, steadily. The annual rate has fallen in most months since the peak:
The cooldown, month by month
Manufacturing construction spending, billions of dollars, seasonally adjusted annual rate
Recent months are preliminary and are revised in later Census releases.
Source: U.S. Census Bureau via FRED (TLMFGCONS)
View the data
| Month | Spending ($ billions, SAAR) |
|---|---|
| Jul 2025 | $215.6 |
| Aug 2025 | $211.1 |
| Sep 2025 | $205.0 |
| Oct 2025 | $202.7 |
| Nov 2025 | $195.2 |
| Dec 2025 | $181.8 |
| Jan 2026 | $184.2 |
| Feb 2026 | $181.9 |
| Mar 2026 | $179.8 |
| Apr 2026 | $177.0 |
| May 2026 | $173.6 |
| Jun 2026 | $171.2 |
| Jul 2026 | $170.3 |
| Aug 2026 | $170.7 |
By August 2026, manufacturing construction stood at about $170.7 billion. That's down about 32% from the September 2024 peak and about 19% from August 2025's $211.1 billion. The most recent months look like a plateau: $171.2 billion in June, $170.3 billion in July and $170.7 billion in August 2026. Those latest figures are preliminary, though, and Census routinely revises them.
The broader construction market has softened too, but less sharply. In its October 1, 2026 release, Census put total U.S. construction spending at a $2,203.1 billion annual rate in August 2026. That's 0.9% above July but 1.7% below August 2025. Year-to-date construction spending was $1,450.4 billion, down 3.1% from the same period of 2025.
How much of all nonresidential building is factories?
Another way to see the boom is manufacturing's share of all nonresidential construction, which also includes offices, warehouses, hospitals, schools, highways and more. We divided the manufacturing series by Census's total nonresidential series for August of each year:
In August 2002, factories were less than 5% of nonresidential construction spending. By August 2021 they were 9.6%. At the height of the boom in August 2024, nearly one in every five dollars of nonresidential construction, 19.1%, went into manufacturing facilities. By August 2026 the share was back down to 13.0%, still well above anything seen before 2022.
Why did the boom happen, and why is it fading?
The data show what happened. They don't explain why, and economists still debate how much each factor mattered. The timing does line up with several things: the post-pandemic push to bring supply chains closer to home, federal programs passed in 2022 that offered grants and tax credits for semiconductor and clean-energy manufacturing, and tariffs that raised the cost of some imports.
The cooldown has a simpler partial explanation. Big projects that broke ground in 2022 and 2023 are moving from construction to equipment installation and operation, so their construction spending winds down. Whether a new wave of projects replaces them will show up in this series over the next year or two.
What does this mean for Made in USA products?
Factory construction is a leading indicator. It shows where future production capacity is being built, not what's being made today. New plants take years to reach full output. Meanwhile, as we've charted in manufacturing output vs. jobs, factories can produce more with fewer workers than they once did.
For shoppers, the practical takeaway is that most American-made products you can buy today come from established plants, many of them decades old, like the Pennsylvania steel mill in our latest news roundup. Tools are a good example of a category where U.S. production never went away:


Channellock makes pliers in Pennsylvania, Estwing forges hammers in Illinois, and W.R. Case & Sons makes pocketknives in Bradford, Pennsylvania. Browse all American-made tools or read our history of U.S. manufacturing jobs since 1939.
Sources
- Total Construction Spending: Manufacturing in the United States (TLMFGCONS)U.S. Census Bureau, via FRED, Federal Reserve Bank of St. Louis, Data through August 2026
- Total Construction Spending: Nonresidential in the United States (TLNRESCONS)U.S. Census Bureau, via FRED, Federal Reserve Bank of St. Louis, Data through August 2026
- Monthly Construction Spending, August 2026 (CB26-158)U.S. Census Bureau, October 1, 2026
- Construction Spending (C30) program overviewU.S. Census Bureau, Accessed October 26, 2026